


Conduent Healthy Communities Institute
Environmental Health / Built Environment, Health / Physical Activity, Physical Determinants of Health
This indicator is archived and is no longer being updated. Click to learn more
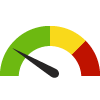
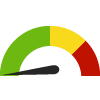
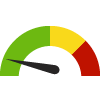
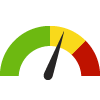
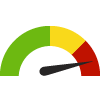
Redis bad, Greenis good, Blueis not statistically different/neutral.
 the value is in the best half of communities.
 the value is in the 2nd worst quarter of communities.
 the value is in the worst quarter of communities.
 meets target;
  does not meet target.
 lower than the comparison value;
higher than the comparison value;
lower than the comparison value;
higher than the comparison value;
 not statistically different from comparison value.

 non-significant change over time;

 significant change over time;
 no change over time.
 higher than the previous measurement period;
 lower than the previous measurement period;
no statistically different change from previous measurement period.
lower than the previous measurement period;
no statistically different change from previous measurement period.
 Better than the overall value.
 Worse than the overall value.
 Similar to the overall value.
 No confidence interval data available.
| Selected Locations |
|---|