Search for Indicators

Healthy People 2030 Progress Tracker

Healthy People 2030 is a comprehensive set of key disease prevention and health promotion objectives. The health objectives and targets allow communities to assess their health status and build an agenda for community health improvement.

Indicator Gauge Icon Legend

Legend Colors

Red is bad, green is good, blue is not statistically different/neutral.

Compared to Distribution

an indicator guage with the arrow in the green the value is in the best half of communities.

an indicator guage with the arrow in the yellow 
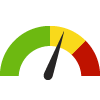
the value is in the 2nd worst quarter of communities.

an indicator guage with the arrow in the red the value is in the worst quarter of communities.

Compared to Target

green circle with white tick inside it meets target; red circle with white cross inside it does not meet target.

Compared to a Single Value

green diamond with downward arrow inside it lower than the comparison value; red diamond with downward arrow inside it higher than the comparison value; blue diamond with downward arrow inside it not statistically different from comparison value.

Trend

green square outline with upward trending arrow inside it green square outline with downward trending arrow inside it non-significant change over time; green square with upward trending arrow inside it green square with downward trending arrow inside it significant change over time; blue square with equals sign no change over time.

Compared to Prior Value

green triangle with upward trending arrow inside it higher than the previous measurement period; green triangle with downward trending arrow inside it lower than the previous measurement period; blue equals sign no statistically different change  from previous measurement period.

More information about the gauges and icons

County: Arlington

Health / Adolescent Health

Value
Compared to:

County: Arlington

Health / Adolescent Health

Value
Compared to:

County: Arlington Teens who get 8 or more Hours of Sleep

Current Value:
28.3%
(2017)
Compared to:
Compared to the HP 2030 Target (27.4%), the target has  been met.
HP 2030 Target
(27.4%)

County: Arlington

Health / Cancer

Value
Compared to:

County: Arlington

Health / Cancer

Value
Compared to:

County: Arlington Age-Adjusted Death Rate due to Breast Cancer

Current Value:
12.9
Deaths per 100,000 females
(2016-2020)
Compared to:
Compared to the HP 2030 Target (15.3), the target has  been met.
HP 2030 Target
(15.3)

County: Arlington Age-Adjusted Death Rate due to Cancer

Current Value:
105.8
Deaths per 100,000 population
(2016-2020)
Compared to:
Compared to the HP 2030 Target (122.7), the target has  been met.
HP 2030 Target
(122.7)

County: Arlington Age-Adjusted Death Rate due to Colorectal Cancer

Current Value:
7.9
Deaths per 100,000 population
(2016-2020)
Compared to:
Compared to the HP 2030 Target (8.9), the target has  been met.
HP 2030 Target
(8.9)

County: Arlington Age-Adjusted Death Rate due to Lung Cancer

Current Value:
16.1
Deaths per 100,000 population
(2016-2020)
Compared to:
Compared to the HP 2030 Target (25.1), the target has  been met.
HP 2030 Target
(25.1)

County: Arlington Age-Adjusted Death Rate due to Prostate Cancer

Current Value:
15.0
Deaths per 100,000 males
(2016-2020)
Compared to:
Compared to the HP 2030 Target (16.9), the target has  been met.
HP 2030 Target
(16.9)

County: Arlington Mammogram in Past 2 Years: 50-74

Current Value:
76.9%
(2020)
Compared to:
Compared to the HP 2030 Target (80.3%), the target has not been met.
HP 2030 Target
(80.3%)

County: Arlington

Health / Health Care Access & Quality

Value
Compared to:

County: Arlington

Health / Health Care Access & Quality

Value
Compared to:

County: Arlington Persons with Health Insurance

Current Value:

County: Arlington Persons with Health Insurance

95.0%
(2021)
Compared to:
Compared to the HP 2030 Target (92.4%), the target has  been met.
HP 2030 Target
(92.4%)
<div>AHS-01: Increase the proportion of people with health insurance <strong>(LEADING HEALTH INDICATOR)</strong></div>

County: Arlington

Health / Heart Disease & Stroke

Value
Compared to:

County: Arlington

Health / Heart Disease & Stroke

Value
Compared to:

County: Arlington Age-Adjusted Death Rate due to Cerebrovascular Disease (Stroke)

26.0
Deaths per 100,000 population
(2018-2020)
Compared to:
Compared to the HP 2030 Target (33.4), the target has  been met.
HP 2030 Target
(33.4)

County: Arlington Age-Adjusted Death Rate due to Coronary Heart Disease

48.8
Deaths per 100,000 population
(2018-2020)
Compared to:
Compared to the HP 2030 Target (71.1), the target has  been met.
HP 2030 Target
(71.1)

County: Arlington High Blood Pressure Prevalence

Current Value:

County: Arlington High Blood Pressure Prevalence

24.7%
(2021)
Compared to:
Compared to the HP 2030 Target (41.9%), the target has  been met.
HP 2030 Target
(41.9%)

County: Arlington

Health / Maternal, Fetal & Infant Health

Value
Compared to:

County: Arlington

Health / Maternal, Fetal & Infant Health

Value
Compared to:

County: Arlington Infant Mortality Rate

Current Value:

County: Arlington Infant Mortality Rate

1.1
Deaths per 1,000 live births
(2020)
Compared to:
Compared to the HP 2030 Target (5.0), the target has  been met.
HP 2030 Target
(5.0)
<div>MICH-02: Reduce the rate of infant deaths <strong>(LEADING HEALTH INDICATOR)</strong></div>

County: Arlington

Health / Mental Health & Mental Disorders

Value
Compared to:

County: Arlington

Health / Mental Health & Mental Disorders

Value
Compared to:

County: Arlington Age-Adjusted Death Rate due to Suicide

Current Value:
5.8
Deaths per 100,000 population
(2018-2020)
Compared to:
Compared to the HP 2030 Target (12.8), the target has  been met.
HP 2030 Target
(12.8)
<div>MHMD-01: Reduce the suicide rate <strong>(LEADING HEALTH INDICATOR)</strong></div>

County: Arlington

Health / Other Conditions

Value
Compared to:

County: Arlington

Health / Other Conditions

Value
Compared to:

County: Arlington Age-Adjusted Death Rate due to Chronic Liver Disease and Cirrhosis

3.8
Deaths per 100,000 population
(2016-2020)
Compared to:
Compared to the HP 2030 Target (10.9), the target has  been met.
HP 2030 Target
(10.9)

County: Arlington

Health / Physical Activity

Value
Compared to:

County: Arlington

Health / Physical Activity

Value
Compared to:

County: Arlington Adults who do not Engage in Physical Activity

Current Value:
10.1%
(2021)
Compared to:
Compared to the HP 2030 Target (21.8%), the target has  been met.
HP 2030 Target
(21.8%)

County: Arlington

Health / Prevention & Safety

Value
Compared to:

County: Arlington

Health / Prevention & Safety

Value
Compared to:

County: Arlington Age-Adjusted Death Rate due to Firearms

Current Value:
2.9
Deaths per 100,000 population
(2018-2020)
Compared to:
Compared to the HP 2030 Target (10.7), the target has  been met.
HP 2030 Target
(10.7)

County: Arlington Age-Adjusted Death Rate due to Unintentional Injuries

21.5
Deaths per 100,000 population
(2018-2020)
Compared to:
Compared to the HP 2030 Target (43.2), the target has  been met.
HP 2030 Target
(43.2)

County: Arlington

Health / Tobacco Use

Value
Compared to:

County: Arlington

Health / Tobacco Use

Value
Compared to:

County: Arlington Adults who Smoke

Current Value:

County: Arlington Adults who Smoke

8.2%
(2021)
Compared to:
Compared to the HP 2030 Target (6.1%), the target has not been met.
HP 2030 Target
(6.1%)
<div>TU-02: Reduce current cigarette smoking in adults <strong>(LEADING HEALTH INDICATOR)</strong></div>

County: Arlington

Health / Wellness & Lifestyle

Value
Compared to:

County: Arlington

Health / Wellness & Lifestyle

Value
Compared to:

County: Arlington Insufficient Sleep

Current Value:

County: Arlington Insufficient Sleep

28.4%
(2020)
Compared to:
Compared to the HP 2030 Target (26.7%), the target has not been met.
HP 2030 Target
(26.7%)

County: Arlington

Community / Transportation

Value
Compared to:

County: Arlington

Community / Transportation

Value
Compared to:

County: Arlington Workers Commuting by Public Transportation

Current Value:
18.5%
(2018-2022)
Compared to:
Compared to the HP 2030 Target (5.3%), the target has  been met.
HP 2030 Target
(5.3%)

County: Arlington

Economy / Poverty

Value
Compared to:

County: Arlington

Economy / Poverty

Value
Compared to:

County: Arlington People Living Below Poverty Level

Current Value:
6.7%
(2018-2022)
Compared to:
Compared to the HP 2030 Target (8.0%), the target has  been met.
HP 2030 Target
(8.0%)

County: Arlington

Education / Student Performance K-12

Value
Compared to:

County: Arlington

Education / Student Performance K-12

Value
Compared to:

County: Arlington High School Graduation

Current Value:

County: Arlington High School Graduation

93.5%
(2023)
Compared to:
Compared to the HP 2030 Target (90.7%), the target has  been met.
HP 2030 Target
(90.7%)